0. 평면 순서도(Flowchart)의 한계를 극복하는 3D 아이소메트릭
전통적인 2D 순서도는 사각형 박스와 화살표만으로 구성되어, 단계가 많아질수록 지루해지고 시각적 몰입감을 잃기 쉽습니다. 특히 B2B 엔터프라이즈 솔루션이나 복잡한 클라우드 아키텍처를 고객에게 제안할 때 평면 다이어그램은 전문성을 온전히 전달하지 못합니다.
graph LR
    A[단계별 작업 노드: Step 1~4] --> B[3D 큐브/글래스 패널 모듈화]
    B --> C[입체 컬러 케이블 & 파이프라인 배선]
    C --> D[아이소메트릭 30도 투영]
D --> E[물리적 장비처럼 실감나는 프로세스 시각화]- 공간적 위계(Spatial Hierarchy): 30도 아이소메트릭(Isometric) 투영법은 가로, 세로, 높이의 3차원 축을 왜곡 없이 표현하여 단계 간의 선후 관계와 입출력(I/O) 흐름을 직관적으로 드러냅니다.
- 케이블 배선 메타포(Cable Pipeline Metaphor): 데이터와 작업이 단순히 선으로 그어지는 대신, 물리적인 전선 케이블, 광섬유 파이프처럼 모듈 사이를 입체적으로 관통함으로써 강력한 엔지니어링 신뢰성을 부여합니다.
1. 레퍼런스 비주얼 정밀 분석 (Deconstruction)
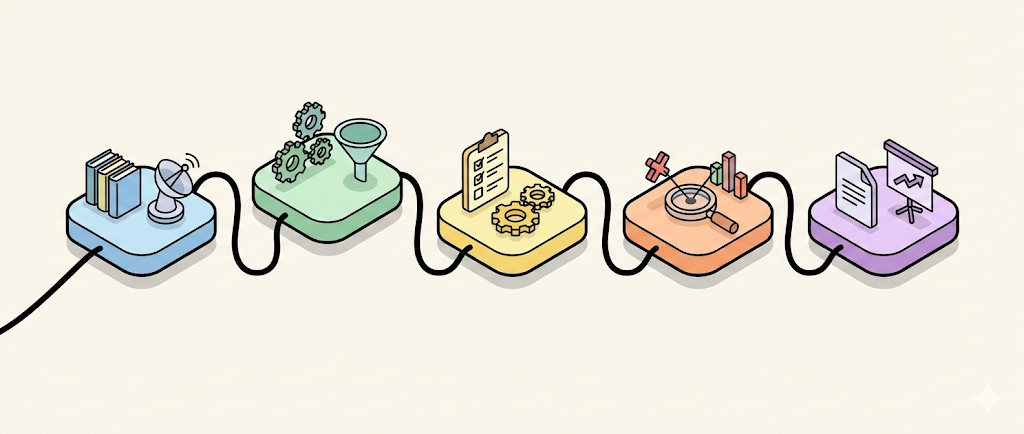
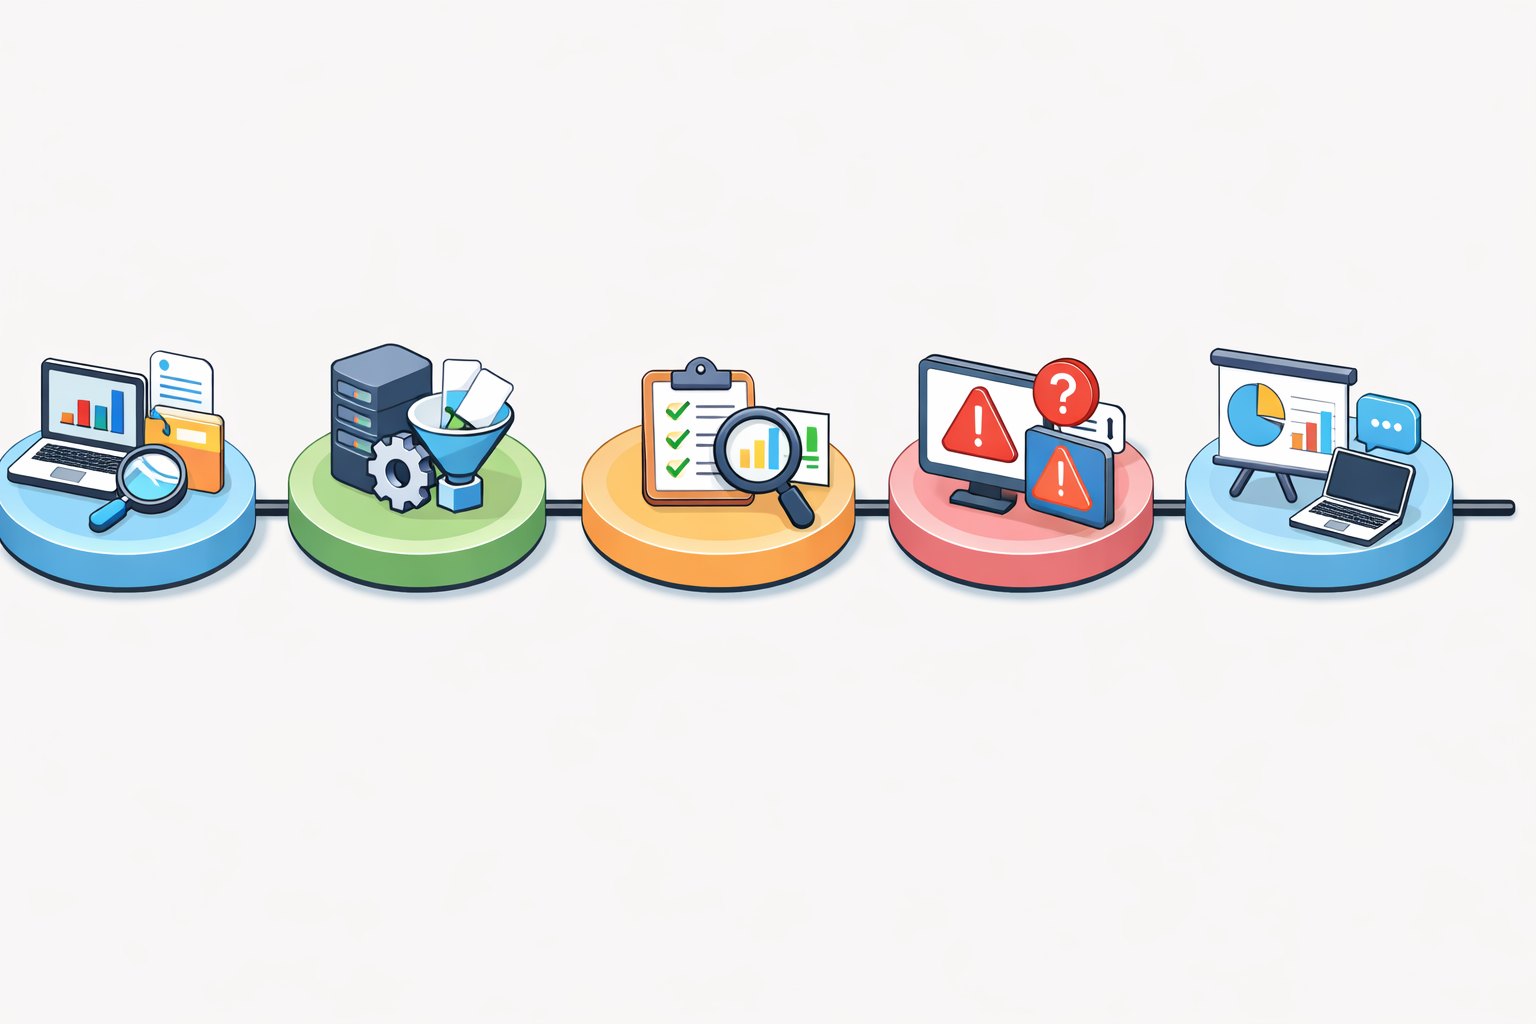
1-1. 시각적 구조 및 파이프라인 배선 법칙
classDiagram
    class IsometricPipeline {
        +Perspective: True Isometric 30-degree grid
        +Nodes: 3 to 5 Elevated Modular Platform Blocks
        +Connectors: Chunky flexible cables looping through ports
        +ColorCoding: Teal, Coral, Yellow, Blue pipeline segregation
        +BasePlate: Clean floating grid floor with ambient contact shadow
}- 스테이지 노드(Stage Nodes):
- 각 단계는 둥근 모서리를 가진 입체 큐브나 투명 아크릴 받침대(Pedestal) 형태로 표현됩니다.
- 각 플랫폼 상단에는 해당 단계를 상징하는 3D 미니어처 오브젝트(서버, 데이터베이스, 체크리스트, AI 코어)가 안착됩니다.
- 케이블 및 도관(Conduits & Cables):
- 얇은 실선이 아니라 적당한 두께를 지닌 두툼한 고무 피복 케이블 또는 발광 광섬유 튜브.
- 모듈의 포트(Port)에 꽂히거나 바닥 위를 우아하게 구부러지며(Gentle S-curves) 다음 모듈로 이어집니다.
- 바닥면과 조명(Ground & Ambient Light):
- 순백색(#FFFFFF) 또는 옅은 아이보리 바닥면.
- 공중에 떠 있는 케이블과 블록 아래로 떨어지는 부드러운 앰비언트 섀도우가 공간감을 완성합니다.
2. 핵심 프롬프트 파라미터 및 키워드 사전
| 속성 영역 | 핵심 영문 프롬프트 키워드 | 비주얼 효과 |
|---|---|---|
| 투영 앵글 | isometric 30-degree perspective, orthographic projection, isometric tech diagram |
왜곡 없는 정확한 3D 아이소메트릭 구도 |
| 연결 부재 | thick flexible colored cables, interconnecting braided wires, industrial pipeline conduits |
모듈 사이를 물리적으로 연결하는 두툼한 케이블 |
| 모듈 표현 | modular floating tech blocks, rounded chamfered pedestals, glassmorphic UI slabs |
하이엔드 테크 감성의 입체 받침대 |
| 전체 스타일 | clean vector-like 3D render, claymorphism style, studio soft lighting |
군더더기 없는 깔끔한 3D 그래픽 |
3. 마스터 JSON 메타 프롬프트 템플릿
{
  "meta_prompt_name": "ProcessFlow_Isometric_CableStyle_v1",
  "intent": "복잡한 절차나 아키텍처를 아이소메트릭 케이블 다이어그램으로 자동 생성",
  "template": {
    "view": "Orthographic isometric view, 30-degree perspective, centered composition",
    "background": "Solid pure white background (#FFFFFF) with delicate contact shadows",
    "workflow_stages": [
      {"step": "01", "name": "[1단계 명칭]", "icon_metaphor": "[데이터 수집 센서 모듈]"},
      {"step": "02", "name": "[2단계 명칭]", "icon_metaphor": "[중앙 AI 프로세싱 큐브]"},
      {"step": "03", "name": "[3단계 명칭]", "icon_metaphor": "[보안 검증 게이트웨이]"},
      {"step": "04", "name": "[4단계 명칭]", "icon_metaphor": "[최종 대시보드 리포트 패널]"}
    ],
    "cable_styling": "Chunky vibrant cables (Teal, Amber, Cobalt Blue) looping gracefully between modules",
    "rendering_engine": "Octane render aesthetic, smooth matte plastic and frosted glass shaders, clean typography labels"
  }
}
4. 즉시 복사 가능한 실전 생성 프롬프트 3종
4-1. [케이스 1] 4단계 AI 데이터 파이프라인 절차도 (레퍼런스 완벽 재현)
An ultra-clean isometric 30-degree infographic diagram representing a 4-step data processing pipeline on a pure white background (#FFFFFF). Four rounded elevated platform blocks aligned sequentially from bottom-left to top-right. Step 1 features a cylindrical raw data silo; Step 2 features an illuminated neural network compute cube; Step 3 features a precision security scanning prism; Step 4 features a glowing analytics monitor. Thick flexible braided cables in teal, energetic coral-orange, and violet loop smoothly between the blocks, physically plugging into ports. Soft studio floor contact shadows, tactile matte polymer materials, crisp modern corporate aesthetic, 8k --ar 16:9 --style raw --v 6.14-2. [케이스 2] 스마트 물류 자동화 풀필먼트 프로세스
A modern 3D isometric workflow diagram illustrating a smart logistics supply chain process. Centered layout on a light cool-gray ground plane. Three interconnected industrial stations: an automated robotic sorting belt, an AI quality inspection chamber with green laser grids, and an automated packing dock with mini drones. Colorful overhead pipeline conduits and braided floor cables connect each station. Micro-labels "01 RECEIVE", "02 INSPECT", "03 DISPATCH" floating neatly beside the units. Highly refined industrial clay render, sharp geometric forms, zero clutter --ar 16:9 --v 6.14-3. [케이스 3] 클라우드 마이크로서비스 배포(CI/CD) 파이프라인
A futuristic isometric tech diagram showing a modern DevOps software deployment lifecycle. Floating translucent glassmorphism cubes representing Code Repository, Automated Testing Engine, Docker Container Build, and Kubernetes Cloud Cluster. Glowing optical fiber cables with pulses of electric cyan light threading through the glass blocks. Pure white background, soft ambient occlusion, crisp lines, silicon valley startup branding visual, presentation ready --ar 16:9 --v 6.15. 실무 후가공 및 다이어그램 라벨링 팁
- 영문 텍스트 제거 후 Figma 한글 오버레이:
- AI가 생성하는 미세 텍스트는 영문이라도 간혹 왜곡될 수 있습니다. 프롬프트에
no text, unlabeled blank plates를 추가하여 깨끗한 3D 구조물만 생성한 뒤, Figma에서 한글 텍스트와 번호 뱃지(01,02,03)를 직접 얹으면 출판물 수준의 완성도를 얻을 수 있습니다.
- AI가 생성하는 미세 텍스트는 영문이라도 간혹 왜곡될 수 있습니다. 프롬프트에
- 슬라이드 애니메이션 연계:
- PPT에서 이미지를 자르기(Crop) 도구로 단계별 모듈 단위로 4개 조각으로 분할한 뒤, ‘밝기 변화’나 ’위에서 아래로 날아오기’ 애니메이션을 순차 적용하면 환상적인 인터랙티브 발표 장표가 완성됩니다.