0. 복잡한 시스템을 한눈에 파악하게 만드는 ‘공간 아키텍처’
기업의 차세대 ERP 구축, 클라우드 마이그레이션, 공공 행정 절차 혁신 등 대형 프로젝트를 진행할 때 수십 쪽짜리 텍스트 기획서보다 강력한 것은 “전체 시스템의 구조와 데이터 흐름이 한눈에 들어오는 단 한 장의 현황도(Status Diagram)”입니다.
graph TD
    A[복잡한 시스템 기획서 & 절차서] --> B[3대 영역 구조화: 입력 -> 처리 코어 -> 산출 대시보드]
    B --> C[3D 모듈러 큐브 & 발광 파이프라인 시각화]
    C --> D[아이소메트릭 그리드 및 명확한 영역 구획]
D --> E[비전문가와 경영진을 단번에 설득하는 마스터 다이어그램]- 인지 부하의 획기적 감축: 수많은 서버, 데이터베이스, API 게이트웨이, 사용자 접점을 3D 큐브와 플랫폼 층위(Layer)로 공간화하여 직관적인 연결 관계를 드러냅니다.
- 범용 템플릿의 유연성: 주제가 물류 시스템이든, 공공 복지 전달 체계든, AI 에이전트 오케스트레이션이든 동일한 아키텍처 문법을 적용하여 신속하게 고품질 다이어그램을 생산할 수 있습니다.
1. 레퍼런스 비주얼 정밀 분석 (Deconstruction)
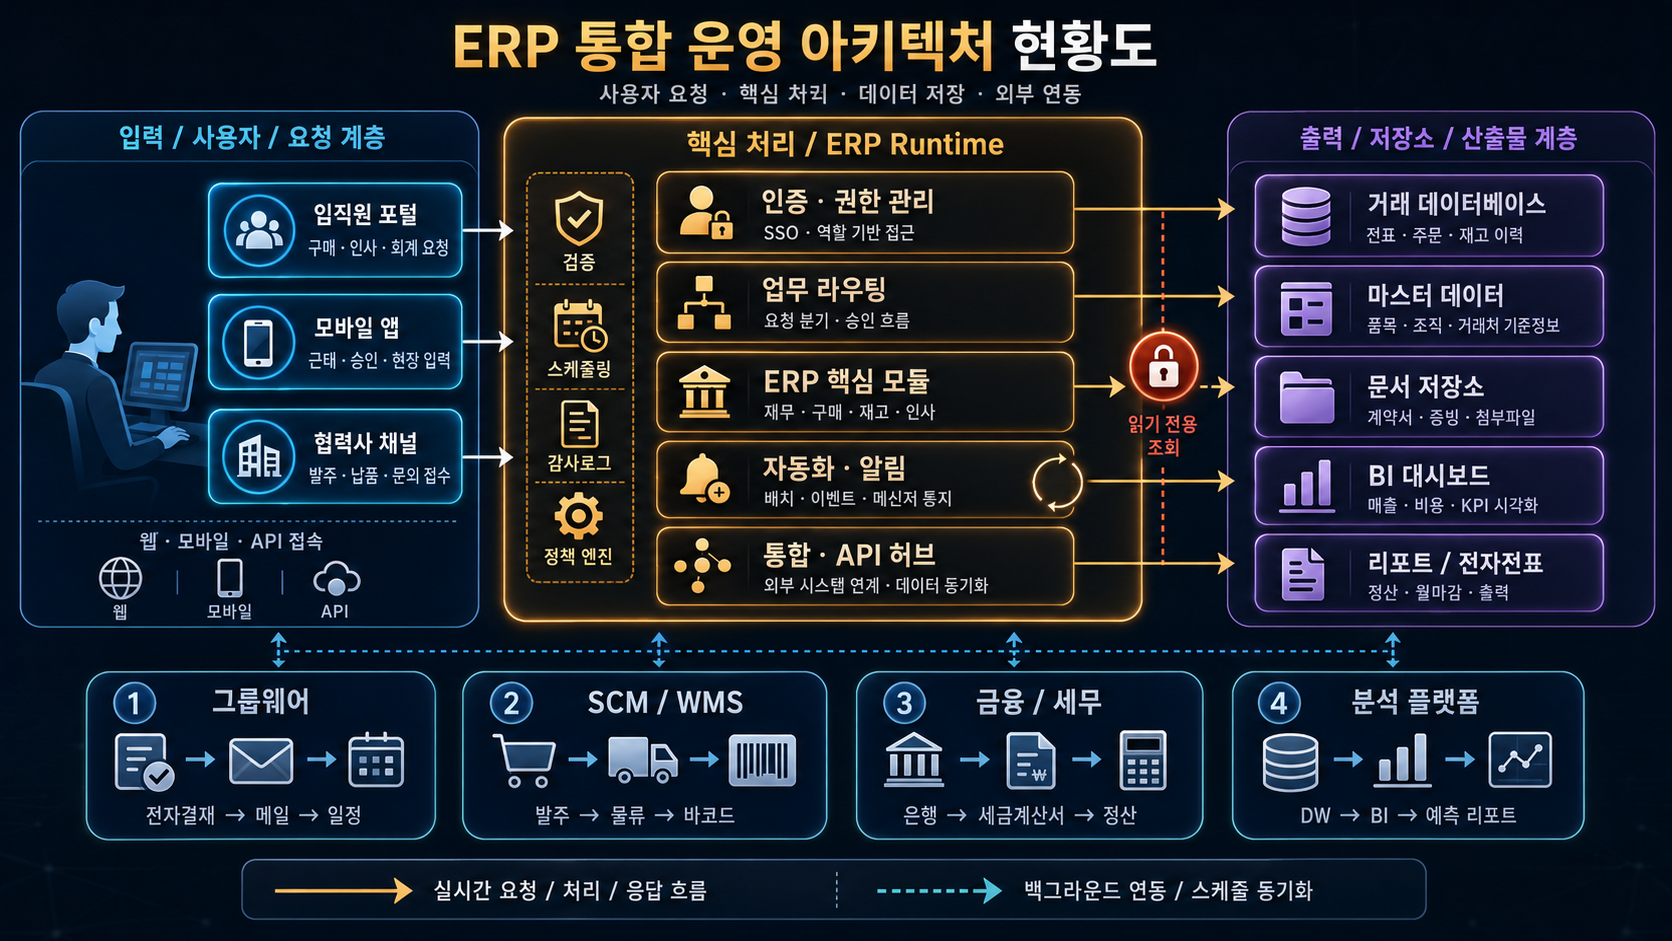
1-1. 범용 아키텍처 4대 레이아웃 구역
classDiagram
    class EnterpriseSystemDiagram {
        +Area1_Input: Left / External Sources (Users, Sensors, Databases, Legacy)
        +Area2_Processing: Center / Core Engine (AI Processor, API Gateway, Rules Engine)
        +Area3_Storage: Center-Lower / Data Layer (Cylindrical Lakes, Repositories)
        +Area4_Output: Right / End Delivery (Dashboards, Mobile Apps, Notifications)
        +Connectors: Luminous energy pipes with direction arrows
}- 입력 구역 (Input Section - 좌측):
- 원천 데이터 소스, 현장 사용자, 외부 연계 기관, IoT 디바이스 모듈.
- 핵심 처리 구역 (Processing Core - 중앙 상단):
- 비즈니스 로직 연산 엔진, AI 분석 코어, 워크플로우 분기 제어 허브.
- 데이터 저장 구역 (Storage Layer - 중앙 하단):
- 클라우드 데이터 레이크, 관계형 DB 실린더, 분산 캐시 스토리지.
- 결과 출력 및 서비스 구역 (Output Section - 우측):
- 관제 대시보드, 모바일 앱 인터페이스, 자동 통보 및 액션 실행 모듈.
2. 범용 마스터 템플릿 패키지 (영문 / 한글 / 축약형)
2-1. 범용 이미지 생성 프롬프트 (영문 마스터)
Create a professional, high-resolution architecture diagram, workflow map, or operational status infographic.

The diagram should visualize the following information clearly:
- Main Title / Subject: [DIAGRAM_TITLE]
- Subtitle / Context: [SUBTITLE_OR_DOMAIN]
- Core Objective: [PRIMARY_GOAL_OF_THIS_DIAGRAM]

Structure and Layout Requirements:
1. Overall Composition: Clean, structured enterprise architecture diagram with clear sections, visual hierarchy, and intuitive reading flow (left-to-right, top-to-bottom, or modular layered layout).
2. Key Sections / Modules to include:
   - Section 1: [SECTION_1_NAME] - [SECTION_1_DETAILS]
   - Section 2: [SECTION_2_NAME] - [SECTION_2_DETAILS]
   - Section 3: [SECTION_3_NAME] - [SECTION_3_DETAILS]
   - Section 4: [SECTION_4_NAME] - [SECTION_4_DETAILS]
3. Visual Style: Modern 3D isometric or clean vector infographic on a solid pure white or subtle neutral studio background. Soft directional lighting, refined contact shadows, translucent UI slabs, crisp geometric blocks.
4. Data Flow & Connections: Luminous pipeline conduits and directional connectors showing clear interaction paths between modules. --ar 16:9 --style raw --v 6.1
2-2. 한국어 전용 지시 프롬프트
[DIAGRAM_TITLE]을 주제로 한 고해상도 시스템 구성도 및 업무 절차도 인포그래픽을 제작하세요.

- 주제 분야: [SUBTITLE_OR_DOMAIN]
- 핵심 목적: [PRIMARY_GOAL_OF_THIS_DIAGRAM]

레이아웃 요구사항:
1. 좌에서 우로 자연스럽게 전개되는 엔터프라이즈 아키텍처 구도.
2. 4대 주요 영역: 입력 연계, 핵심 처리 엔진, 데이터 스토리지, 최종 서비스 대시보드.
3. 시각 스타일: 순백색 배경(#FFFFFF) 위의 3D 아이소메트릭 모듈러 큐브, 부드러운 앰비언트 그림자, 정돈된 컬러 파이프라인.
2-3. 초압축 복붙용 프롬프트 (빠른 프로토타이핑)
High-resolution 3D isometric system architecture flowchart for [TOPIC]. Clean white background, modular glassmorphic server cubes, colored data pipeline tubes, left-to-right logical flow, enterprise tech aesthetic, crisp vectors, 8k --ar 16:9 --v 6.13. 즉시 복사 가능한 실전 생성 프롬프트 2종
3-1. [케이스 1] 차세대 엔터프라이즈 스마트 ERP 통합 운영도
A professional high-resolution 3D isometric system architecture diagram for Next-Generation Enterprise Smart ERP Platform on a pure white background. Left: Legacy DB migration and multi-channel sales inputs; Center: Cloud microservices orchestrator with real-time AI inventory optimization core; Center-bottom: Secure distributed ledger database cylinders; Right: Executive BI dashboard with real-time KPI graphs. Colorful braided pipeline cables connecting modules with directional flow indicators. Soft ambient floor shadows, Scandinavian corporate design aesthetic, presentation ready --ar 16:9 --style raw --v 6.13-2. [케이스 2] 스마트 시티 통합 관제 및 도시 안전 절차도
A futuristic 3D isometric operational status infographic for Smart City Public Safety and Traffic Management Center. The layout flows from Left (CCTV camera feeds, IoT road sensors, emergency 911 calls) through Center (AI anomaly detection computer vision hub and predictive traffic simulation platform) to Right (Police and ambulance automated dispatch units and mobile citizen emergency warning system). Translucent floating UI cards, vivid teal and amber energy conduits, pure white studio ground plane, crystal clarity, 8k --ar 16:9 --v 6.14. 실무 제안서 및 보고서 최적화 팁
- 영역별 컬러 코딩 통일:
- 슬라이드 내에서 ‘입력=파란색’, ‘핵심처리=보라색’, ’출력=초록색’과 같이 색상 규칙을 엄격히 고정하면 청중이 복잡한 다이어그램을 보는 순간 직관적으로 구조를 이해합니다.
- 파워포인트 하이퍼링크 결합:
- 각 3D 모듈 영역 위에 투명한 사각형 도형을 그리고, 해당 모듈을 상세히 설명하는 하위 슬라이드로 이동하는 하이퍼링크를 걸어두면 최고급 인터랙티브 발표 덱이 완성됩니다.